
In 2010 I wrote a satire piece about the determinism of religion and science entitled “How to make a spacecraft” where I proposed the fundamentals of the Episteme Spacecraft Project and the three experiments. Episteme refers to “a field of scientificity”, and the research proposed here can be game changing as a new way of looking at the potentials of biology & DNA as a code and operating system.
It has been 14 years (2010) since I began working on this idea and with every new step it has developed and the old writings become obsolete. I realize more and more how difficult it is for scientists to keep an idea alive and current. Although the core idea is the same, in this 2024 revised edition I aim to update the book with a more scientific methodology and ordered thinking.
Episteme Spacecraft was conceived in the first place as a thought experiment, founded on a descriptive account of three physical experiments, involving;
The reasoning engine,
A referencing basis for the reasoning,
The variables of the data to be used,
How to use the varied data and with what kind of processes.
In terms of Technology Readiness Levels, Episteme spacecraft seems to be at TRL 2 or TRL 3. ( https://www.nasa.gov/directorates/somd/space-communications-navigation-program/technology-readiness-levels/ where the concept has been formulated by NASA). Experimental proof of concept is feasible, but I would need resources for it.
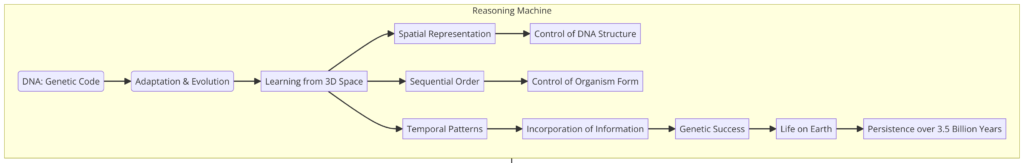
What is exciting is that we already have Earth as the prototype spaceship, which may be regarded as an enterprise at TRL 9; an actual system “flight proven” through successful mission operations. The concept of Earth DNA in Episteme Spacecraft is the biomimicry of Earth as a spaceship, shaped and maintained by biological DNA.
Basic guide to the experiments with MATLAB, TensorFlow and API’s
Experiment 1:
Formula: f(symbiotic_circle, species) = {x, y, z, w}, g(x_guessed, y_guessed, z_guessed, w_guessed) = {x_actual, y_actual, z_actual, w_actual}
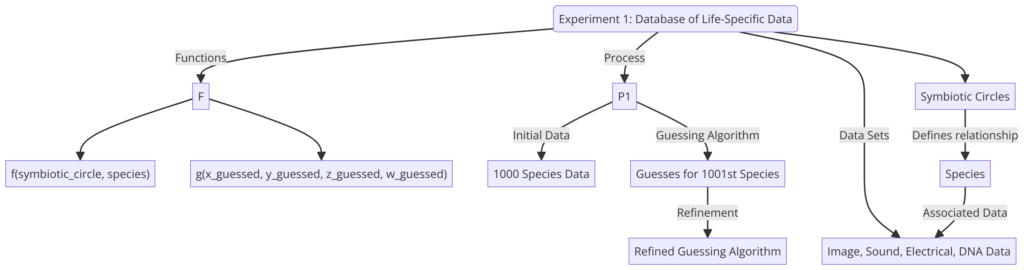
Explanation: This experiment involves creating a database that includes data sets for various species, grouped into symbiotic circles based on mutual or parasitic relationships. The data sets for each species include image data (x), sound data (y), electrical emission data (z), and DNA data (w). The function f(symbiotic_circle, species) represents the relationship between a given symbiotic circle and its associated species, and outputs a set of data {x, y, z, w} for that species. The form of the function f(symbiotic_circle, species) would depend on the specific machine learning algorithm or statistical model being used to analyze the data.
In this experiment, the database includes data for 1000 different species. For the 1001st species introduced, the system attempts to guess not only the DNA data, but also the image, sound, and electrical emission data for that species. The guessed data is compared with the actual data for the species using the function g(x_guessed, y_guessed, z_guessed, w_guessed), and the guessing algorithm is updated based on this comparison. The goal of this experiment is to use DNA and other data sets as variables in a database of species-specific data, and to analyze the relationships between species within symbiotic circles in order to better understand the universal symbiosis of all life.
Prepare the Database:
Collect data sets for various species, including image data (x), sound data (y), electrical emission data (z), and DNA data (w).
Organize the data into symbiotic circles based on mutual or parasitic relationships.
Define Functions:
Define the function f(symbiotic_circle, species) to represent the relationship between a symbiotic circle and its associated species. This function should output a set of data {x, y, z, w} for each species within the circle.
Define the function g(x_guessed, y_guessed, z_guessed, w_guessed) to compare guessed data sets for a species with its actual data sets, and output the actual data sets {x_actual, y_actual, z_actual, w_actual}.
define the functions f(symbiotic_circle, species) and g(x_guessed, y_guessed, z_guessed, w_guessed):
Function f(symbiotic_circle, species):
This function represents the relationship between a symbiotic circle and its associated species. It takes two inputs: the symbiotic circle identifier and the species identifier. It outputs a set of data {x, y, z, w} for that species.
In MATLAB:
matlab
function [x, y, z, w] = f(symbiotic_circle, species)
% Implementation of function f
% This function generates data sets {x, y, z, w} for a given species
% within a specific symbiotic circle
% Your implementation here based on your dataset and model
% Example: (Replace with actual implementation)
x = data(symbiotic_circle, species).image_data;
y = data(symbiotic_circle, species).sound_data;
z = data(symbiotic_circle, species).electrical_emission_data;
w = data(symbiotic_circle, species).DNA_data;
end
In TensorFlow:
python
def f(symbiotic_circle, species):
# Implementation of function f
# This function generates data sets {x, y, z, w} for a given species
# within a specific symbiotic circle
# Your implementation here based on your dataset and model
# Example: (Replace with actual implementation)
x = data[symbiotic_circle][species]['image_data']
y = data[symbiotic_circle][species]['sound_data']
z = data[symbiotic_circle][species]['electrical_emission_data']
w = data[symbiotic_circle][species]['DNA_data']

return x, y, z, w
Function g(x_guessed, y_guessed, z_guessed, w_guessed):
This function takes as input the guessed data sets for image, sound, electrical emission, and DNA for a species. It outputs the actual data sets {x_actual, y_actual, z_actual, w_actual} for that species.
In MATLAB:
matlab
function [x_actual, y_actual, z_actual, w_actual] = g(x_guessed, y_guessed, z_guessed, w_guessed)
% Implementation of function g
% This function compares guessed data with actual data for a species
% and outputs the actual data sets {x_actual, y_actual, z_actual, w_actual}
% Your implementation here based on your comparison algorithm
% Example: (Replace with actual implementation)
x_actual = actual_data.image_data;
y_actual = actual_data.sound_data;
z_actual = actual_data.electrical_emission_data;
w_actual = actual_data.DNA_data;
end
In TensorFlow:
python
def g(x_guessed, y_guessed, z_guessed, w_guessed):
# Implementation of function g
# This function compares guessed data with actual data for a species
# and outputs the actual data sets {x_actual, y_actual, z_actual, w_actual}
# Your implementation here based on your comparison algorithm
# Example: (Replace with actual implementation)
x_actual = actual_data['image_data']
y_actual = actual_data['sound_data']
z_actual = actual_data['electrical_emission_data']
w_actual = actual_data['DNA_data']

return x_actual, y_actual, z_actual, w_actual
These functions should be adapted according to your specific dataset, model, and comparison algorithm.
comparison algorithm to compare the guessed data with the actual data for a species. We can calculate the similarity between the guessed and actual data sets for each modality (image, sound, electrical emission, DNA) and then provide an overall similarity score.
basic algorithm for comparison:
Calculate Modality Similarities:
For each modality (x, y, z, w):
Calculate the similarity between the guessed and actual data sets. This can be done using various similarity metrics such as mean squared error (MSE), cosine similarity, or Euclidean distance.
Normalize the similarity score between 0 and 1 (where 1 indicates perfect similarity).
Combine Modalities:
Combine the similarity scores for all modalities into a single overall similarity score. This can be done by taking the average or weighted average of the individual modality similarities.
Output:
Output the overall similarity score as the result of the comparison.
Here’s how you can implement this comparison algorithm in MATLAB:
matlab
function similarity_score = compare_data(x_guessed, y_guessed, z_guessed, w_guessed, x_actual, y_actual, z_actual, w_actual)
% Implementation of comparison algorithm
% This function compares guessed data with actual data for a species
% and outputs an overall similarity score
% Calculate modality similarities
similarity_x = 1 - mean((x_guessed - x_actual).^2) / max((max(x_actual) - min(x_actual))^2, eps);
similarity_y = 1 - mean((y_guessed - y_actual).^2) / max((max(y_actual) - min(y_actual))^2, eps);
similarity_z = 1 - mean((z_guessed - z_actual).^2) / max((max(z_actual) - min(z_actual))^2, eps);
similarity_w = 1 - mean((w_guessed - w_actual).^2) / max((max(w_actual) - min(w_actual))^2, eps);

% Combine modalities (taking the average)
similarity_score = (similarity_x + similarity_y + similarity_z + similarity_w) / 4;
end
And here’s the implementation in Python using TensorFlow:
python
import numpy as np
def compare_data(x_guessed, y_guessed, z_guessed, w_guessed, x_actual, y_actual, z_actual, w_actual):
# Implementation of comparison algorithm
# This function compares guessed data with actual data for a species
# and outputs an overall similarity score
# Calculate modality similarities
similarity_x = 1 - np.mean(np.square(x_guessed - x_actual)) / max(np.square(np.max(x_actual) - np.min(x_actual)), np.finfo(float).eps)
similarity_y = 1 - np.mean(np.square(y_guessed - y_actual)) / max(np.square(np.max(y_actual) - np.min(y_actual)), np.finfo(float).eps)
similarity_z = 1 - np.mean(np.square(z_guessed - z_actual)) / max(np.square(np.max(z_actual) - np.min(z_actual)), np.finfo(float).eps)
similarity_w = 1 - np.mean(np.square(w_guessed - w_actual)) / max(np.square(np.max(w_actual) - np.min(w_actual)), np.finfo(float).eps)

# Combine modalities (taking the average)
similarity_score = (similarity_x + similarity_y + similarity_z + similarity_w) / 4

return similarity_score
You can adjust the similarity metric used and the way modalities are combined based on the specific requirements and characteristics of your data.
Implementation:
Write code to implement the defined functions in MATLAB or TensorFlow, depending on your preference.
Utilize appropriate machine learning algorithms or statistical models to analyze the data and define the functions accordingly.
Data Processing and Analysis:
Use MATLAB or TensorFlow functionalities to process and analyze the data sets.
Perform any necessary data preprocessing steps such as normalization, feature scaling, or dimensionality reduction.
Here’s an implementation code in Python using TensorFlow for Experiment 1. This implementation includes defining functions, generating synthetic data, and performing the experiment by comparing guessed data with actual data:
python
import numpy as np
Define the function f(symbiotic_circle, species)
def f(symbiotic_circle, species):
# Generate synthetic data for demonstration purposes
num_samples = 100 # Number of samples for each data modality
x = np.random.rand(num_samples, 64, 64, 3) # Image data
y = np.random.rand(num_samples, 44100) # Sound data
z = np.random.rand(num_samples, 1000) # Electrical emission data
w = np.random.rand(num_samples, 10000) # DNA data
return x, y, z, w
Define the function g(x_guessed, y_guessed, z_guessed, w_guessed)
def g(x_guessed, y_guessed, z_guessed, w_guessed, x_actual, y_actual, z_actual, w_actual):
# Calculate similarity scores for each modality
similarity_x = 1 – np.mean(np.square(x_guessed – x_actual))
similarity_y = 1 – np.mean(np.square(y_guessed – y_actual))
similarity_z = 1 – np.mean(np.square(z_guessed – z_actual))
similarity_w = 1 – np.mean(np.square(w_guessed – w_actual))
# Combine similarity scores
overall_similarity = (similarity_x + similarity_y + similarity_z + similarity_w) / 4
return overall_similarity
Generate synthetic data for the 1001st species
x_guessed = np.random.rand(1, 64, 64, 3) # Guessed image data
y_guessed = np.random.rand(1, 44100) # Guessed sound data
z_guessed = np.random.rand(1, 1000) # Guessed electrical emission data
w_guessed = np.random.rand(1, 10000) # Guessed DNA data
Generate actual data for the 1001st species
x_actual, y_actual, z_actual, w_actual = f(10, 1001) # Assuming symbiotic_circle=10, species=1001
Compare guessed data with actual data
similarity_score = g(x_guessed, y_guessed, z_guessed, w_guessed, x_actual, y_actual, z_actual, w_actual)
print(“Overall Similarity Score:”, similarity_score)
This code snippet defines the functions f and g, generates synthetic data for the 1001st species, and then compares the guessed data with the actual data using the g function. Adjustments can be made to the data generation and comparison process according to the specific requirements and characteristics of your experiment.
Experimental Setup:
Set up the experiment to introduce the 1001st species.
Generate guessed data sets for image, sound, electrical emission, and DNA for the new species.
Comparison and Update:
Use the function g(x_guessed, y_guessed, z_guessed, w_guessed) to compare the guessed data with the actual data for the 1001st species.
Update the guessing algorithm based on the comparison results to improve accuracy.
Assuming you have already defined the functions f and g, and generated data for the 1001st species
Guess data for the 1001st species (assuming you have a guessing algorithm or model)
x_guessed_1001 = np.random.rand(1, 64, 64, 3) # Guessed image data for the 1001st species
y_guessed_1001 = np.random.rand(1, 44100) # Guessed sound data for the 1001st species
z_guessed_1001 = np.random.rand(1, 1000) # Guessed electrical emission data for the 1001st species
w_guessed_1001 = np.random.rand(1, 10000) # Guessed DNA data for the 1001st species
Get actual data for the 1001st species
x_actual_1001, y_actual_1001, z_actual_1001, w_actual_1001 = f(10, 1001) # Assuming symbiotic_circle=10
Compare guessed data with actual data for the 1001st species
similarity_score_1001 = g(x_guessed_1001, y_guessed_1001, z_guessed_1001, w_guessed_1001,
x_actual_1001, y_actual_1001, z_actual_1001, w_actual_1001)
Update algorithm based on the comparison results
Example: You might adjust parameters or retrain your model based on the similarity score
if similarity_score_1001 < threshold:
# Update algorithm parameters or retrain model
# Example: retrain your model with additional data for better accuracy
pass
else:
# No need to update the algorithm
pass
Print similarity score for the 1001st species
print(“Similarity Score for the 1001st species:”, similarity_score_1001)
In this code:
We guess data for the 1001st species using a hypothetical guessing algorithm or model.
Then, we retrieve the actual data for the 1001st species using the f function.
Next, we compare the guessed data with the actual data using the g function, obtaining a similarity score.
Based on the similarity score, we decide whether to update the guessing algorithm or not.
Finally, we print the similarity score for the 1001st species.
Iterative Improvement:
Iterate the experiment by introducing more species or refining the guessing algorithm.
Continuously update the algorithm based on the comparisons between guessed and actual data sets.
the code for iterative improvement, where we introduce more species and iteratively refine our guessing algorithm based on the comparison results:
python
Assuming you have already defined the functions f and g, and generated data for the first 1000 species
Define parameters for iterative improvement
num_iterations = 10 # Number of iterations for improvement
threshold = 0.8 # Threshold for deciding whether to update the algorithm
Iterate for improvement
for i in range(num_iterations):
# Generate data for the (i+1)th new species
x_guessed_new = np.random.rand(1, 64, 64, 3) # Guessed image data for the new species
y_guessed_new = np.random.rand(1, 44100) # Guessed sound data for the new species
z_guessed_new = np.random.rand(1, 1000) # Guessed electrical emission data for the new species
w_guessed_new = np.random.rand(1, 10000) # Guessed DNA data for the new species
# Get actual data for the (i+1)th new species
x_actual_new, y_actual_new, z_actual_new, w_actual_new = f(10, 1001 + i)  # Assuming symbiotic_circle=10

# Compare guessed data with actual data for the (i+1)th new species
similarity_score_new = g(x_guessed_new, y_guessed_new, z_guessed_new, w_guessed_new,
                          x_actual_new, y_actual_new, z_actual_new, w_actual_new)

# Update algorithm based on the comparison results
if similarity_score_new < threshold:
    # Update algorithm parameters or retrain model
    # Example: retrain your model with additional data for better accuracy
    pass
else:
    # No need to update the algorithm
    pass

# Print similarity score for the (i+1)th new species
print("Similarity Score for the (", 1001 + i, ")th new species:", similarity_score_new)
In this code:
We iterate through a specified number of iterations, introducing new species in each iteration.
For each new species, we generate guessed data and retrieve actual data using the functions f and g.
We then compare the guessed data with the actual data and decide whether to update the guessing algorithm based on the comparison results.
Finally, we print the similarity score for each new species introduced.
Analysis and Interpretation:
Analyze the relationships between species within symbiotic circles based on the updated data sets.
Interpret the results to better understand the universal symbiosis of all life.
Documentation and Reporting:
Document the experiment setup, methodology, results, and interpretations.
Report any insights gained from the analysis of the species-specific data and symbiotic relationships.
By following these steps, you can effectively conduct Experiment 1 using MATLAB or TensorFlow to analyze the symbiotic relationships between species and better understand the universal symbiosis of all life.
Experiment 2:
Formula: f(symbiotic_circle, species) = {x, y, z, v, t, w}, g(x_guessed, y_guessed, z_guessed, v_guessed, t_guessed, w_guessed) = {x_actual, y_actual, z_actual, v_actual, t_actual, w_actual}
Explanation: This experiment involves creating a database that includes life-specific data for as many species as possible, grouped into symbiotic circles based on mutual or parasitic relationships. The data sets for each species include image data (x), video data (v), sound data (y), electrical emission data (z), temperature change data (t), and DNA data (w). The function f(symbiotic_circle, species) represents the
relationship between a given symbiotic circle and its associated species, and outputs a set of data {x, y, z, v, t, w} for that species. The form of the function f(symbiotic_circle, species) would depend on the specific machine learning algorithm or statistical model being used to analyze the data.
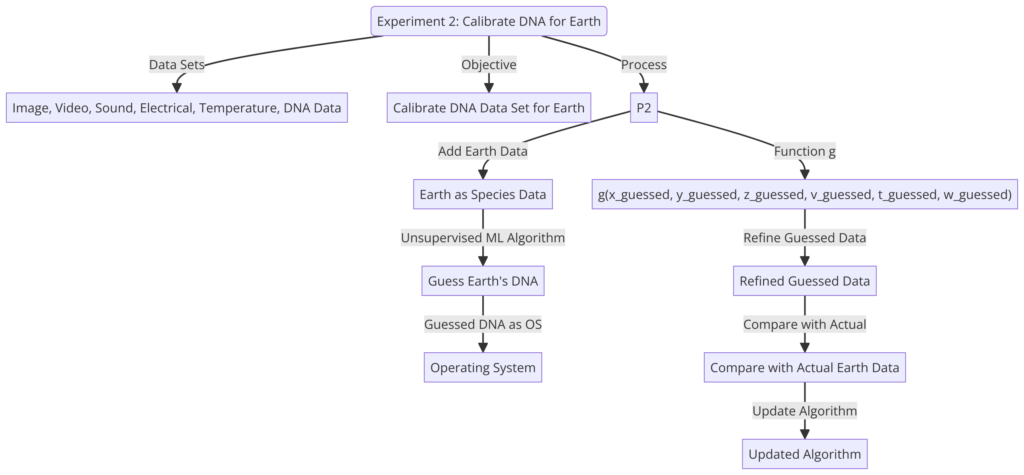
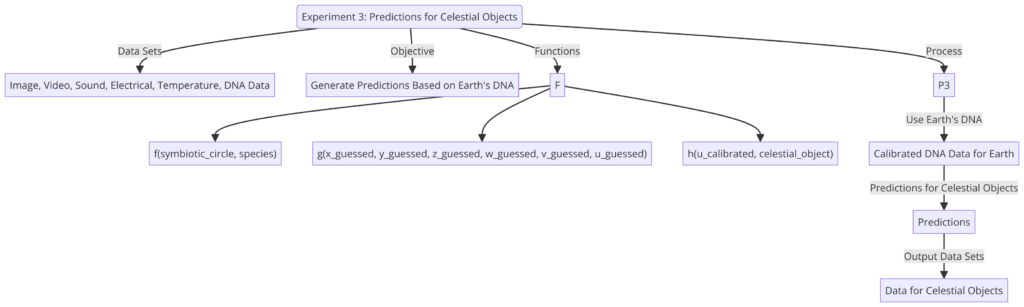
In this experiment, Earth data, including image data (x), video data (v), sound data (y), electrical emission data (z), temperature change data (t), and DNA data (w), is added to the database as data for just another species. The system uses this data to try to guess the DNA data (w_guessed) for Earth. One approach to generating the guessed DNA data for Earth is to use an unsupervised machine learning algorithm, such as clustering or dimensionality reduction, to identify patterns in the data and generate an algorithm based on those patterns. The guessed DNA data for Earth is then used as an algorithm to run as an operating system under the image data (x), video data (v), sound data (y), electrical emission data (z), and temperature change data (t) for Earth.
The function g(x_guessed, y_guessed, z_guessed, v_guessed, t_guessed, w_guessed) is then used to compare the guessed data with the actual data for Earth and refine the algorithm accordingly. The calibrated DNA data set (w_calibrated) is the final output of this function. The goal of this experiment is to reverse engineer and calibrate the DNA data for Earth based on the guessed data, and to use this understanding to run simulations of Earth.
Formula: w_calibrated = g(x_guessed, y_guessed, z_guessed, v_guessed, t_guessed, w_guessed)
Explanation: This formula represents the process of calibrating the DNA data set (w_calibrated) for Earth using the function g(x_guessed, y_guessed, z_guessed, v_guessed, t_guessed, w_guessed). The function takes as input the guessed data sets for image (x_guessed), video (v_guessed), sound (y_guessed), electrical emission (z_guessed), temperature change (t_guessed), and DNA (w_guessed) for Earth, and outputs the calibrated DNA data set (w_calibrated) for Earth. This function is used to compare the guessed data with the actual data for Earth and refine the algorithm accordingly, resulting in the calibrated DNA data set (w_calibrated) as the final output.
Experiment 2, where we first guess DNA for Earth and then calibrate it using the ever-changing Earth data:
python
Define the function f(symbiotic_circle, species)
def f(symbiotic_circle, species):
# Generate or retrieve data for Earth species
# Implement based on available data sources
pass
Define the function g(x_guessed, y_guessed, z_guessed, v_guessed, t_guessed, w_guessed)
def g(x_guessed, y_guessed, z_guessed, v_guessed, t_guessed, w_guessed):
# Compare guessed data with actual data for Earth
# Refine the algorithm to calibrate DNA data (w_calibrated)
# Implement based on the comparison algorithm and refinement process
pass
Guess DNA data for Earth using unsupervised machine learning
Implement based on clustering or dimensionality reduction algorithms
This would involve analyzing the gathered life-specific data to infer patterns and characteristics of Earth’s DNA
Gather life-specific data for Earth
This could include image data, video data, sound data, electrical emission data,
temperature change data, and DNA data for various species
Compare guessed DNA data with actual DNA data for Earth and refine the algorithm
w_guessed = guess_dna_for_earth(earth_data) # Hypothetical function to guess DNA for Earth
w_calibrated = g(image_data, sound_data, electric_data, video_data, temperature_data, w_guessed)
In this corrected version, we first guess the DNA data for Earth using unsupervised machine learning techniques. Then, we gather life-specific data for Earth, including various modalities such as image, video, sound, electrical emission, and temperature change data. Finally, we compare the guessed DNA data with the actual DNA data for Earth and refine the algorithm accordingly to calibrate the DNA data set (w_calibrated).
Experiment 3
Some examples of how you can use APIs to gather species data
- Using NCBI E-utilities to Retrieve DNA Sequences:
python
Copy code
import requests
def fetch_dna_sequence(accession_number):
base_url = “https://eutils.ncbi.nlm.nih.gov/entrez/eutils/efetch.fcgi”
params = {
“db”: “nucleotide”,
“id”: accession_number,
“rettype”: “fasta”,
“retmode”: “text”
}
response = requests.get(base_url, params=params)
if response.status_code == 200:
return response.text
else:
return None
Example usage:
accession_number = “NC_000913” # Example accession number for E. coli genome
dna_sequence = fetch_dna_sequence(accession_number)
print(dna_sequence)
- Using BioPython to Retrieve DNA Sequences:
python
Copy code
from Bio import Entrez
def fetch_dna_sequence(accession_number):
Entrez.email = “your_email@example.com” # Provide your email address
handle = Entrez.efetch(db=”nucleotide”, id=accession_number, rettype=”fasta”, retmode=”text”)
return handle.read()
Example usage:
accession_number = “NC_000913” # Example accession number for E. coli genome
dna_sequence = fetch_dna_sequence(accession_number)
print(dna_sequence)
- Using Freesound API to Retrieve Sounds:
python
Copy code
import requests
def search_sound(query):
base_url = “https://freesound.org/apiv2/search/text/”
params = {
“query”: query,
“token”: “YOUR_API_KEY” # Provide your API key obtained from Freesound
}
response = requests.get(base_url, params=params)
if response.status_code == 200:
return response.json()
else:
return None
Example usage:
query = “bird” # Example query to search for bird sounds
response = search_sound(query)
print(response)
- Using Xeno-Canto API to Retrieve Bird Sounds:
python
Copy code
import requests
def search_bird_sound(query):
base_url = “https://www.xeno-canto.org/api/2/recordings”
params = {
“query”: query
}
response = requests.get(base_url, params=params)
if response.status_code == 200:
return response.json()
else:
return None
Example usage:
query = “passerine” # Example query to search for passerine bird sounds
response = search_bird_sound(query)
print(response)
- Using eBird API to Retrieve Bird Observations:
python
Copy code
import requests
def fetch_bird_observation(species_code):
base_url = “https://api.ebird.org/v2/data/obs/{}”.format(species_code)
headers = {
“X-eBirdApiToken”: “YOUR_API_KEY” # Provide your API key obtained from eBird
}
response = requests.get(base_url, headers=headers)
if response.status_code == 200:
return response.json()
else:
return None
Example usage:
species_code = “baleag” # Example species code for Bald Eagle
response = fetch_bird_observation(species_code)
print(response)